SPLC 2020 Experiments
This page summarizes the experiments conducted on several projects with symfinder, as reported in the paper submitted at SPLC 2020.
The YouTube demo video is here.
The source code of symfinder is available here (tag: splc2020).
The output visualization of symfinder for all projects is deployed here.
Overview of the new features
You can click on the visualization excerpts to view them full size.
Identification of variability implementations in C++ codebases
symfinder is now able to identify variability implementations in codebases written in C++. We analysed two such projects:
Decaf Compiler
This project is a compiler for the Decaf language, developed as an example for an academic course. From such a project, we expect a clear architecture, which is what we obtain on the visualization when displaying all variants.
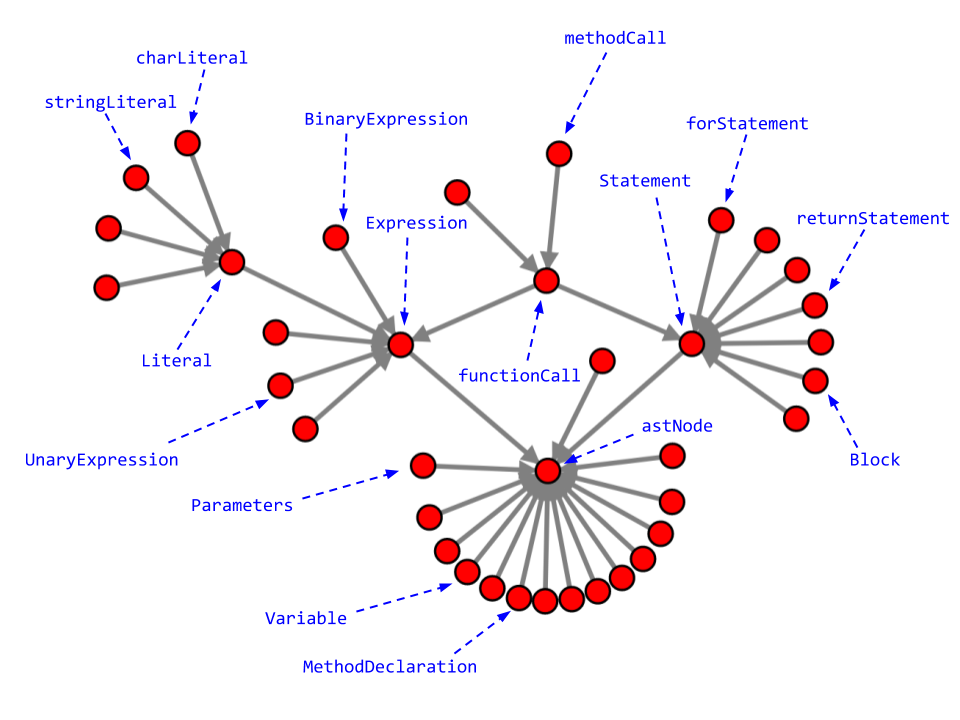
The uniform method level variability is expected in such a small project.
However, variability at class level is greatly present, and exhibits the different elements from the domain, for example
Expression or astNode and its variants representing the different types of nodes available in the AST of the Decaf language.
MuseScore
MuseScore is a free music notation and composition software. Hence, variability from the music field is expected, and found on the visualization when displaying all variants.
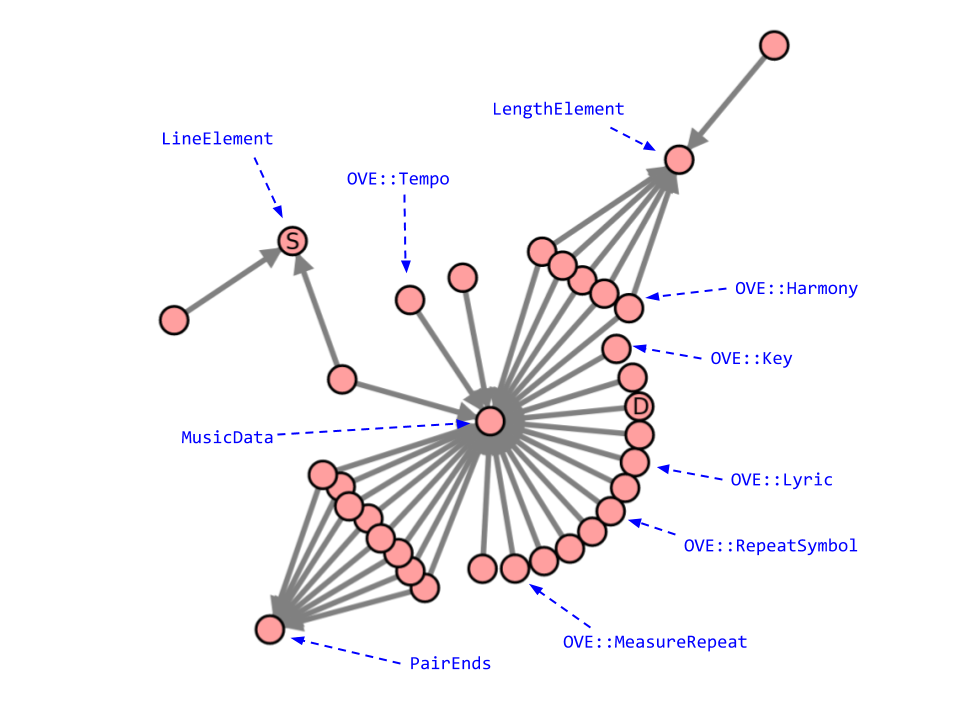
The MusicData variation points represent the behaviour common to all its variants being elements of a musical score.
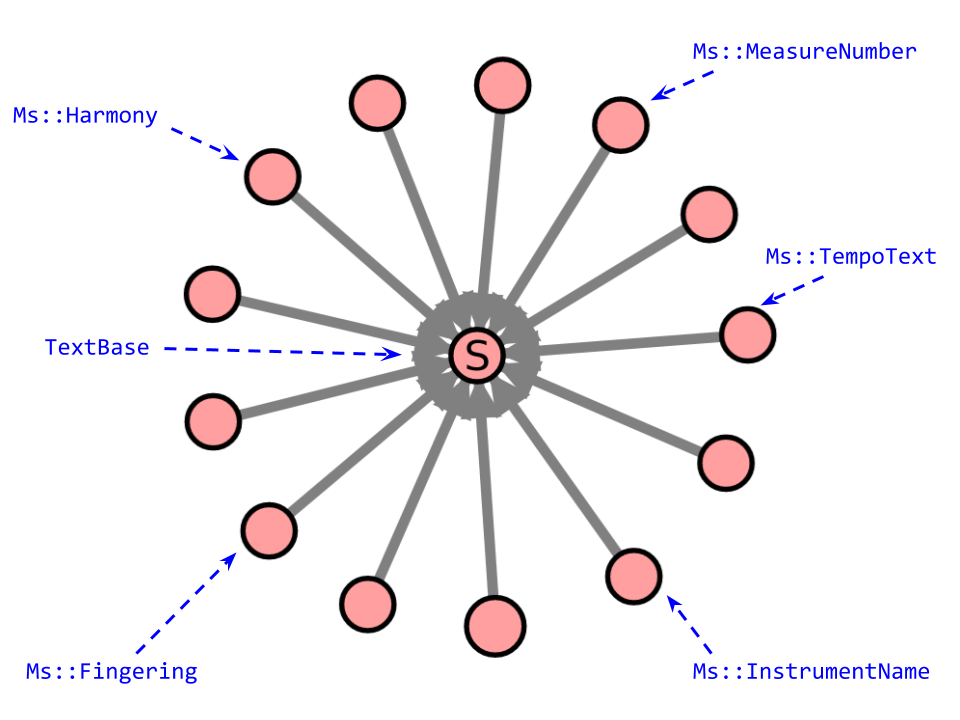
The following vp, TextBase, and its variants represent the different textual elements than can be added to a score.
Other variability implementations can be seen on the visualization and are related to the user interface of the software.
Automated mapping with feature traces
When feature traces are present in code assets and are available in a textual form, symfinder is able to automatically map those traces to the vp-s and variants it identified. An example of such project is ArgoUML-SPL, an SPL which has been extracted by Couto et al. from a Java codebase. Its traces are available in the shape of text files.
Excerpt of ACTIVITYDIAGRAM.txt:
org.argouml.uml.diagram.state.ui.FigTransition
org.argouml.uml.ui.behavior.state_machines.ActionNewCallEvent createEvent(Object)
org.argouml.uml.diagram.ui.ActionAddConcurrentRegion Refinement
org.argouml.uml.diagram.ui.ActionAddConcurrentRegion isEnabled() Refinement
A complete description of the expected format for traces is available on symfinder’s repository.
A set of Python scripts are deployed in another Docker container using these traces and the vp-s and variants output by symfinder to map them, and calculates two measures:
- precision (proportion of vp-s and variants having at least a feature trace)
- recall (proportion of assets having at least a feature trace being vp-s or variants)
Number of VPs and variants linked to features (TP): 562
Number of VPs and variants not linked to features (FP): 726
Number of features traces not linked to any VP nor variant (FN): 152
Number of traces (TP + FN): 714
Number of VPs / variants (TP + FP): 1288
Precision = TP / (TP + FP): 0.4363354037267081
Recall = TP / (TP + FN): 0.7871148459383753
A JSON file is then generated and used in the visualization to color the border of nodes possessing at least a feature trace in blue.
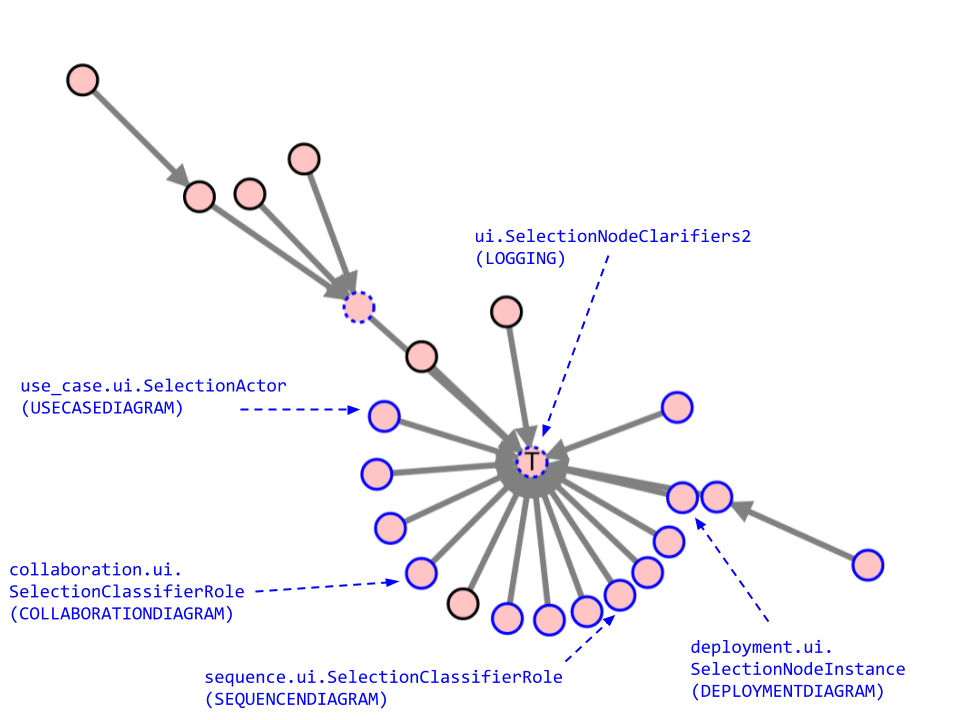
All classes represented on the legend of this excerpt belong to org.argouml.uml.diagram package. For the sake of simplicity, we omitted this part in the names of the classes.
Coloring nodes belonging to a common package
Finally, symfinder is now able to color nodes belonging to a common package.
A Color packages button is available in the top bar of symfinder, where one can add or removes packages (Java) or namespaces (C++) to color.
For each package, symfinder determines a new color.
The excerpt below illustrates the use of this feature on the visualization of JFreeChart:
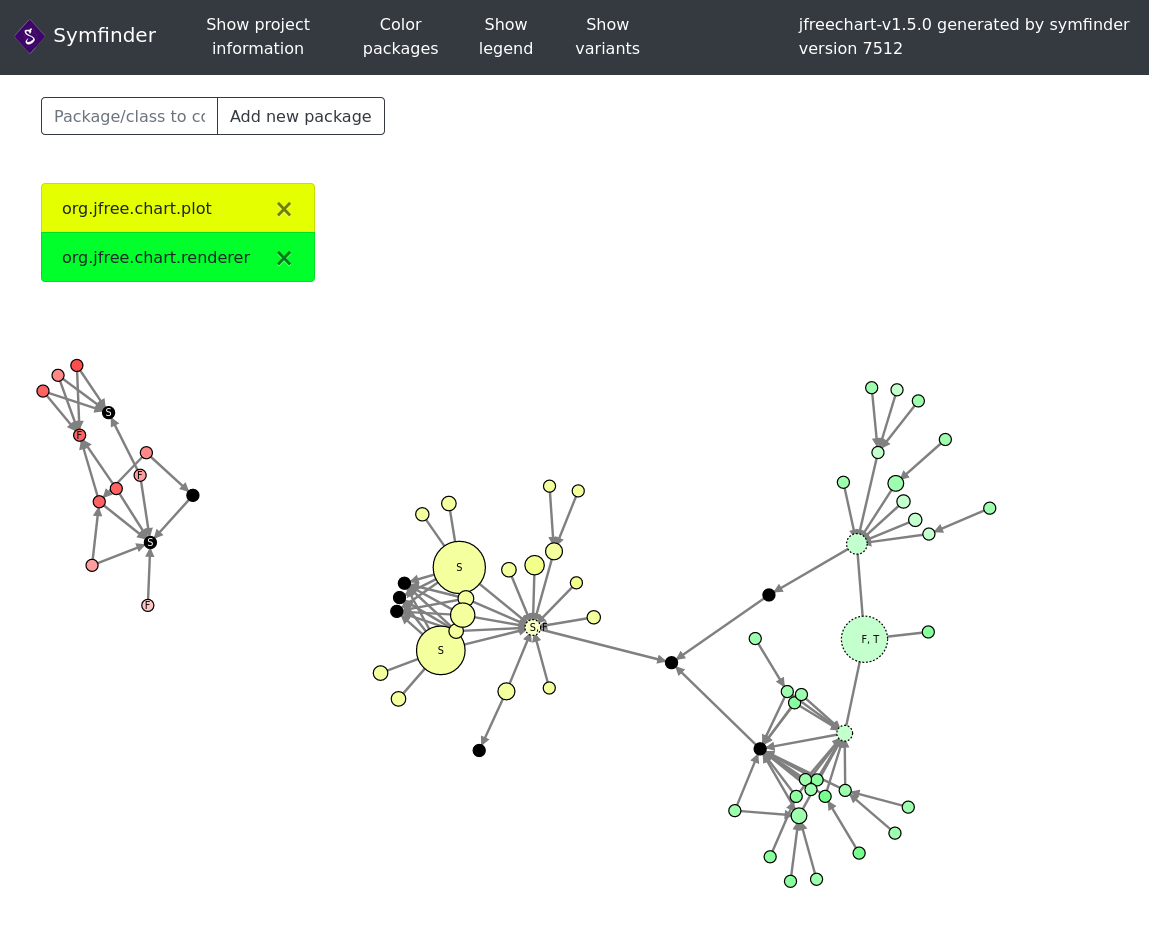
By coloring the org.jfree.chart.plot and org.jfree.chart.renderer, we observe that classes from these packages are represented as a tree made of two subtrees connected by interfaces, one for each package.
This illustrates a good separation of concerns between these two packages.